Loading briefings…
← ALL BRIEFINGSFULL REPORT · SERVED INLINE
Product walkthrough · reading the board
How do F1 Fantasy price changes work? — and how to read them off the Budget Builder
Short answer to how F1 Fantasy price changes work: a driver's price moves on points per million — how much he scored against what he cost — averaged over a rolling window. Score well enough for the money, and the price rises. Fall short, and it drops. The Budget Builder's job is to turn that into a number you can act on: how many points each driver needs next race to move each way.
The one thing to get straight first
The board does not show you a price a driver has to reach. It shows you a points target that would produce a price move. That distinction is the whole feature, and it explains a layout that otherwise looks strange — as you will see in section 3.
1. It is free, but it needs an account
Unlike the Team Builder, which works without an account, the Budget Builder asks you to sign in first. There is no charge and no card — the tables, every threshold, the forecast column and the model toggle are all free. One extra layer needs a plan, and it is flagged in section 8.
2. One row, left to right
Everything the board knows about a driver, in one line.

- $Current price, in millions.
- $±The predicted move after the next race — not a record of what already happened. Green is a forecast rise, red a forecast fall. It is a probability-weighted expectation, which is why it carries two decimals when real price moves land in fixed steps.
- R−2 R−1What he actually scored in the last two races. These feed the rolling average that drives everything to their right. A dash means no score is on file for that round — a gap, not a zero.
- FCSTProjected points for the coming race, from whichever model you have selected. On a phone this same column is labelled FRCT.
- FORMA three-point sparkline: the two past races, then the projection.
- −0.3 …The four threshold cells. Read section 3 before you read these — they are the part everyone misreads.
3. How do F1 Fantasy price changes work on the board?
The headers are dollars. The cells are points.

This is the single most confusing thing on the page, and it is worth thirty seconds.
The header +0.3 means "a rise of thirty cents". The number in the cell underneath is
the score he needs for that to happen. So a cell reading 18 under
+0.3 means: score 18 points or more next race and the price should go up $0.30.
Two other cell forms appear:
- ≤ 12A ceiling, not a floor — score 12 or fewer and the price falls by that column's amount.
- ≤ anyAny score at all triggers it. Usually a driver whose price is falling almost regardless.
Where the numbers come from
The thresholds are our model of F1 Fantasy's cost-cap rule, reconstructed from observed behaviour rather than published by the game. They are a good guide, not an oracle, and they are least reliable in the opening races of a season when there is barely any scoring history to average.
4. What the colours mean
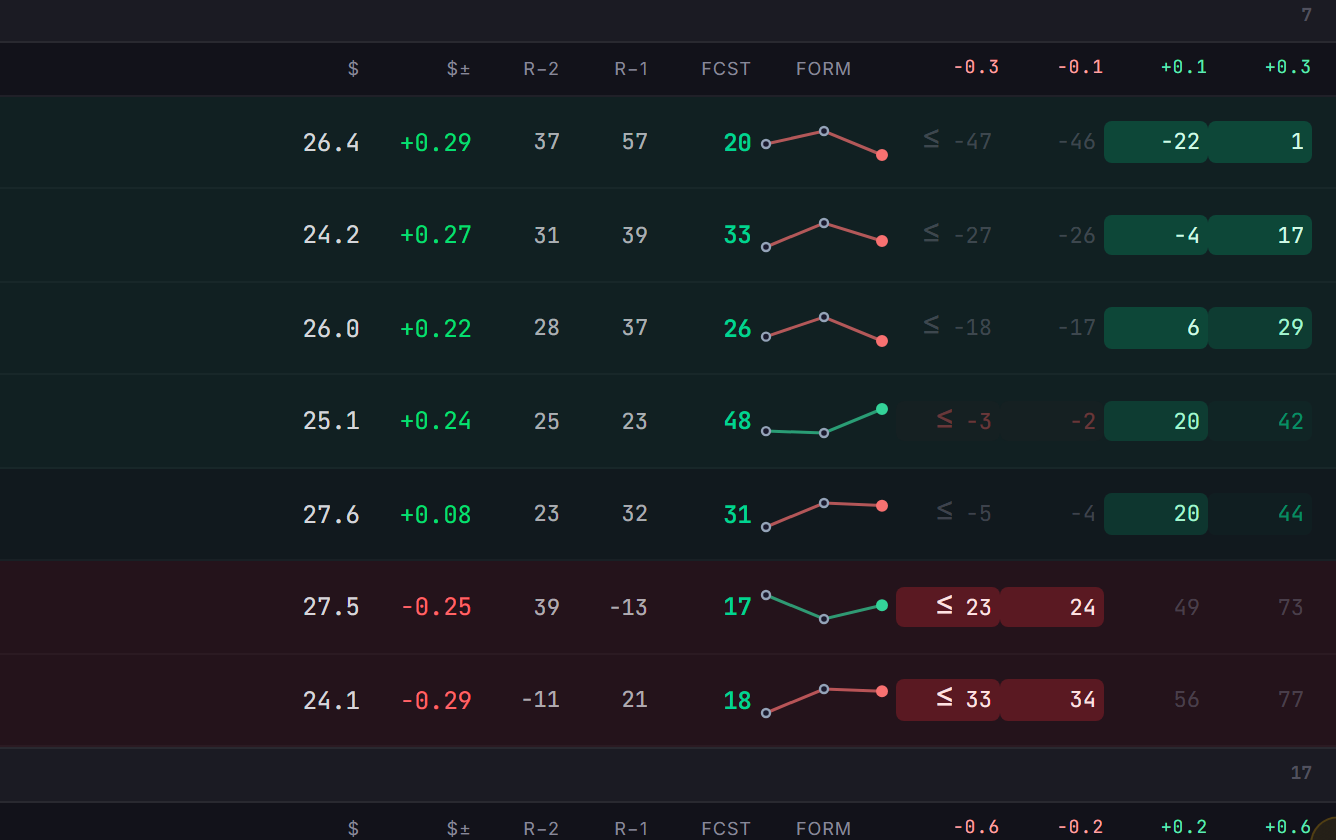
- greenA price rise.
- redA price fall.
- strengthHow likely that move is, given his recent scoring. A vivid cell is a confident call; a barely-tinted one is a long shot that is still worth seeing.
- greyNot realistically in reach. This — not red — is the "ignore it" state.
Read this one the right way round
A strong red cell is not noise. It means the drop is likely. The cells you can safely skip are the grey ones.
5. A padlock is not a paywall

Prices in this game are bounded. A driver already sitting at the floor cannot fall further, and one at the ceiling cannot rise, so the corresponding cells have nothing to show. The board marks them with a small padlock and a dash. It uses the same padlock glyph as the genuine subscriber lock in section 8, which is unfortunate — but in a threshold cell it is always about the price bounds, never about your plan.
You will also see a small Floor or Ceiling chip beside $± on those rows. Filled means the price is pinned and cannot move at all; an outline means it can still move, just less than the model would otherwise predict.
6. Two labels that mean something other than you would guess

The board splits into Tier A (the expensive half, $18.5M and up) and Tier B (everyone cheaper). The split exists because the two groups move in different step sizes: Tier A in $0.10 and $0.30 increments, Tier B in $0.20 and $0.60. That is why the four threshold headers change when you cross the divider.
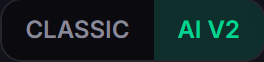
CLASSIC is the long-running model; AI V2 is tuned for the current season. Switching re-ranks the board, because the projection feeds the rolling average that produces every threshold. If two people compare boards and disagree, this toggle is usually why.
7. How often F1 Fantasy price changes actually happen
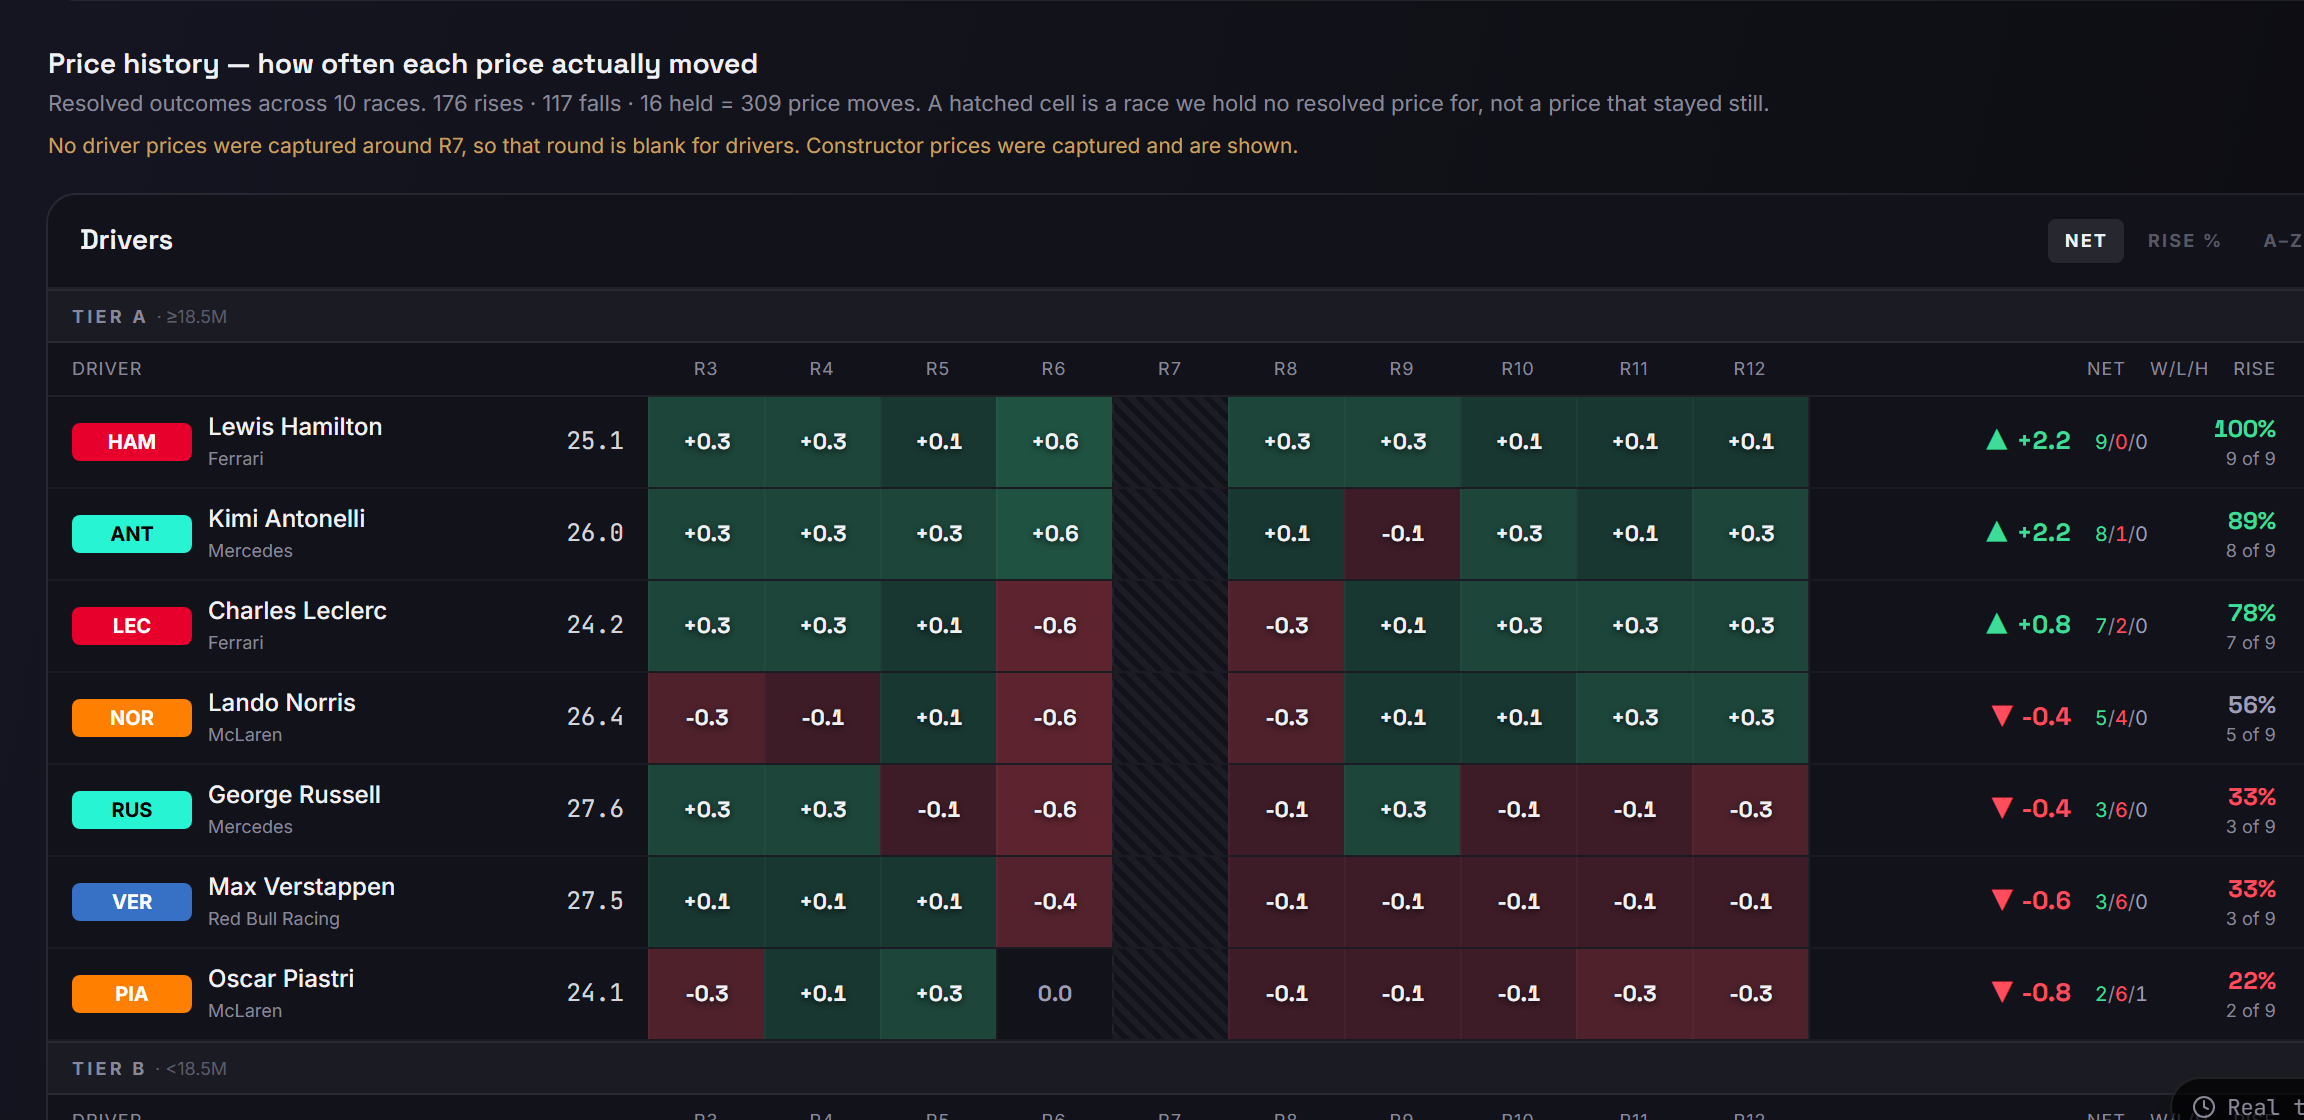
Forecasts are easier to trust when you can see the track record. This panel shows how often each asset's price has actually moved, which is the fastest way to sanity-check a confident-looking threshold against a driver whose price has barely budged all year.
8. Your own seven, marked
The one part of the page that needs a plan.
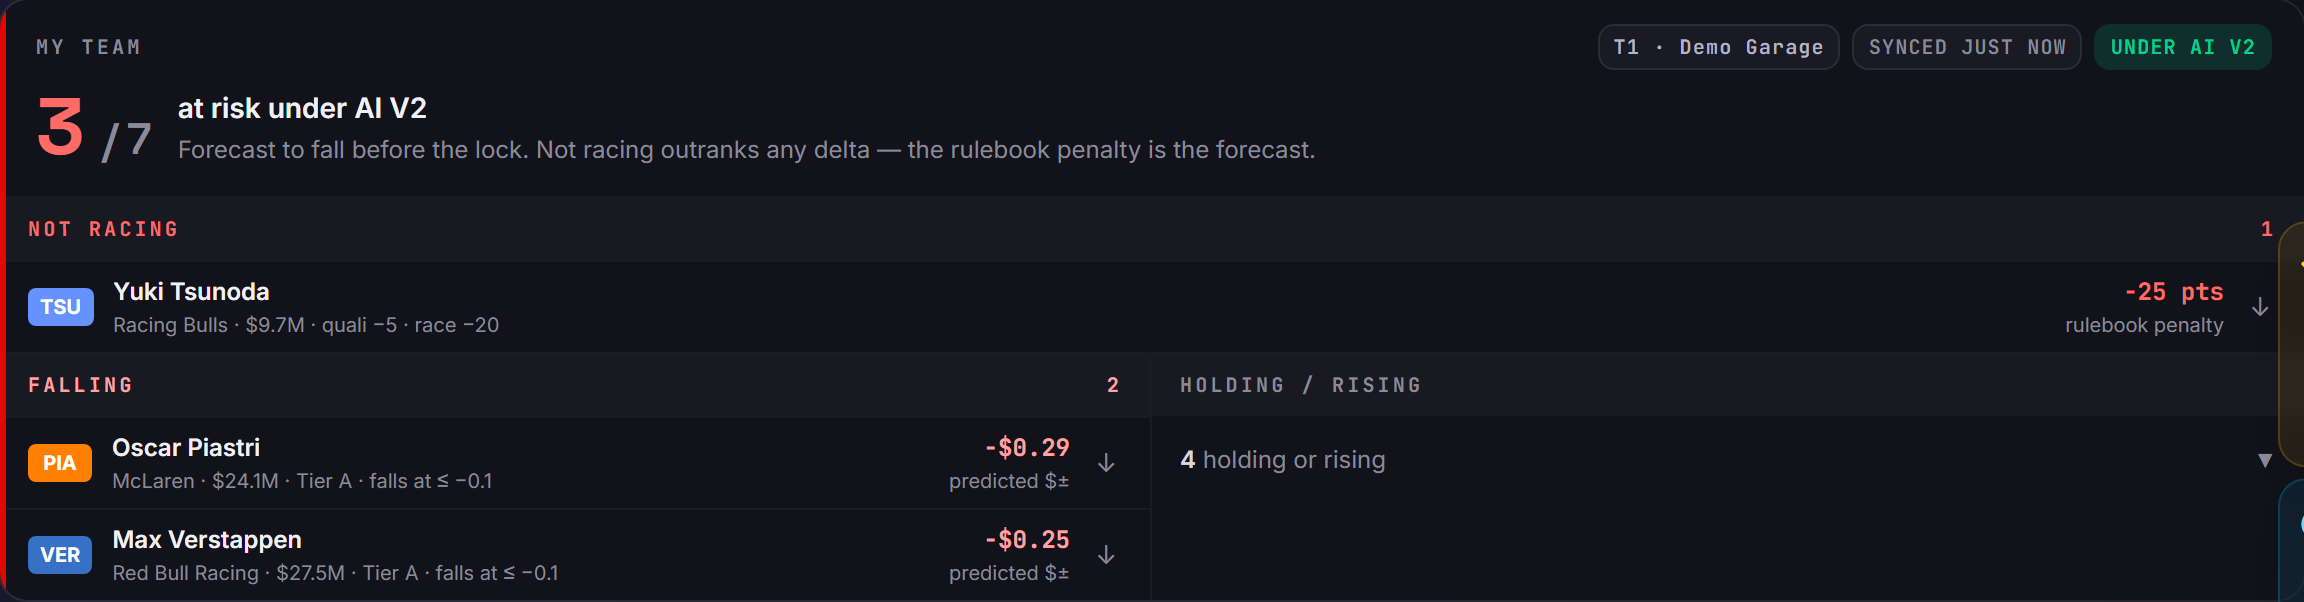
Link your F1 Fantasy team and the board marks your own picks, then sorts them into three groups, worst first:
- Not racingA seat that will not score. This outranks any price forecast — a driver who is not on the grid is the problem, whatever his threshold says.
- FallingForecast to drop by at least one full step. Note this is a step, not any negative number at all — see below.
- Holding / risingEveryone else, collapsed by default.

"Falling" is stricter than it sounds
A driver forecast at −$0.09 will not appear under Falling, even though that number is negative — he has not reached the first full step down. He sits in Holding / rising, labelled as holding. The groups are about crossing a threshold, not about the sign of a number.
9. What costs money
| On this page | Signed out | Free account | Standard |
|---|---|---|---|
| Both tables, every threshold, the colours | Sign-in card only | Yes | Yes |
| Forecast column and the model toggle | — | Yes | Yes |
| Price-history panel | — | Yes | Yes |
| Your seven marked, and the risk board | — | No | Yes |
Without a plan the my-team slot shows an upgrade strip instead of a board. It genuinely holds nothing back behind a blur — the roster is simply never loaded.
10. On a phone
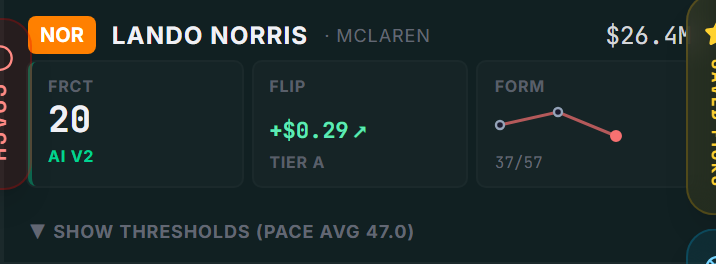
Three tiles carry the summary — FRCT (the same value desktop labels FCST), FLIP (the headline predicted move, or hold), and FORM. The four threshold cells live behind Show thresholds, along with a plain-English sentence about any floor or ceiling on that driver.
Your call
Price movement is the slowest-moving edge in this game and the easiest to plan around: the thresholds for the next race are visible days ahead. The board will tell you what each driver needs to score and how likely that is. What it will not tell you is whether a forecast rise is worth the points you would give up to chase it — that trade is yours, and it is the one worth thinking about.
Open the Budget Builder, and pair it with the Team Builder when you want the points side of the same decision.